
MCF Weekly Capital Market Review - December 9th, 2019
Trump hinted last week that it would be better “to wait until after the election for the China deal” and that he had no deadline in mind.[1] Equities had a small selloff on Monday as a result but finished the week positive. The comments come a week after the US House passed the Hong Kong bill and China hardened its stance by demanding all US tariffs be rolled back before striking any deal.[2] Despite the apparent widening between parties, China will continue working on tax exemptions for soybeans and pork imported from the US.[3] However, this may be a policy of necessity as the African swine fever outbreak this year has wiped out an estimated 300 million or almost half of China’s pigs.[4]
Another round of 15% tariffs is scheduled for December 15 on the remaining ~$150 billion of Chinese imports; a deal and repeal by then remains uncertain.[5] In Europe, Trump is now vowing to retaliate against a 3% revenue tax on digital company earnings in France, targeting items such as cheese and luxury handbags.[6] This comes days after tariffs were proposed against Brazilian and Argentine steel and aluminum. France is a top 10 exporter to the US but the entire European Union (EU) is second after China.[7],[8] The concern for market participants would be this spiraling into another large-scale trade war if other EU members are dragged into the fight.
PMI and ISM manufacturing indices showed mixed results for November. Construction spending was slower than expected. Consumer sentiment is up for December, exceeding expectations. Labor markets continue to roar with a huge beat on new jobs for November, especially in manufacturing.[9] The unemployment rate now sits at 3.5%, a number not seen since 1969.[10]
This week will feature releases on CPI, PPI, and retail sales, in addition to the last Federal Reserve meeting for the year.
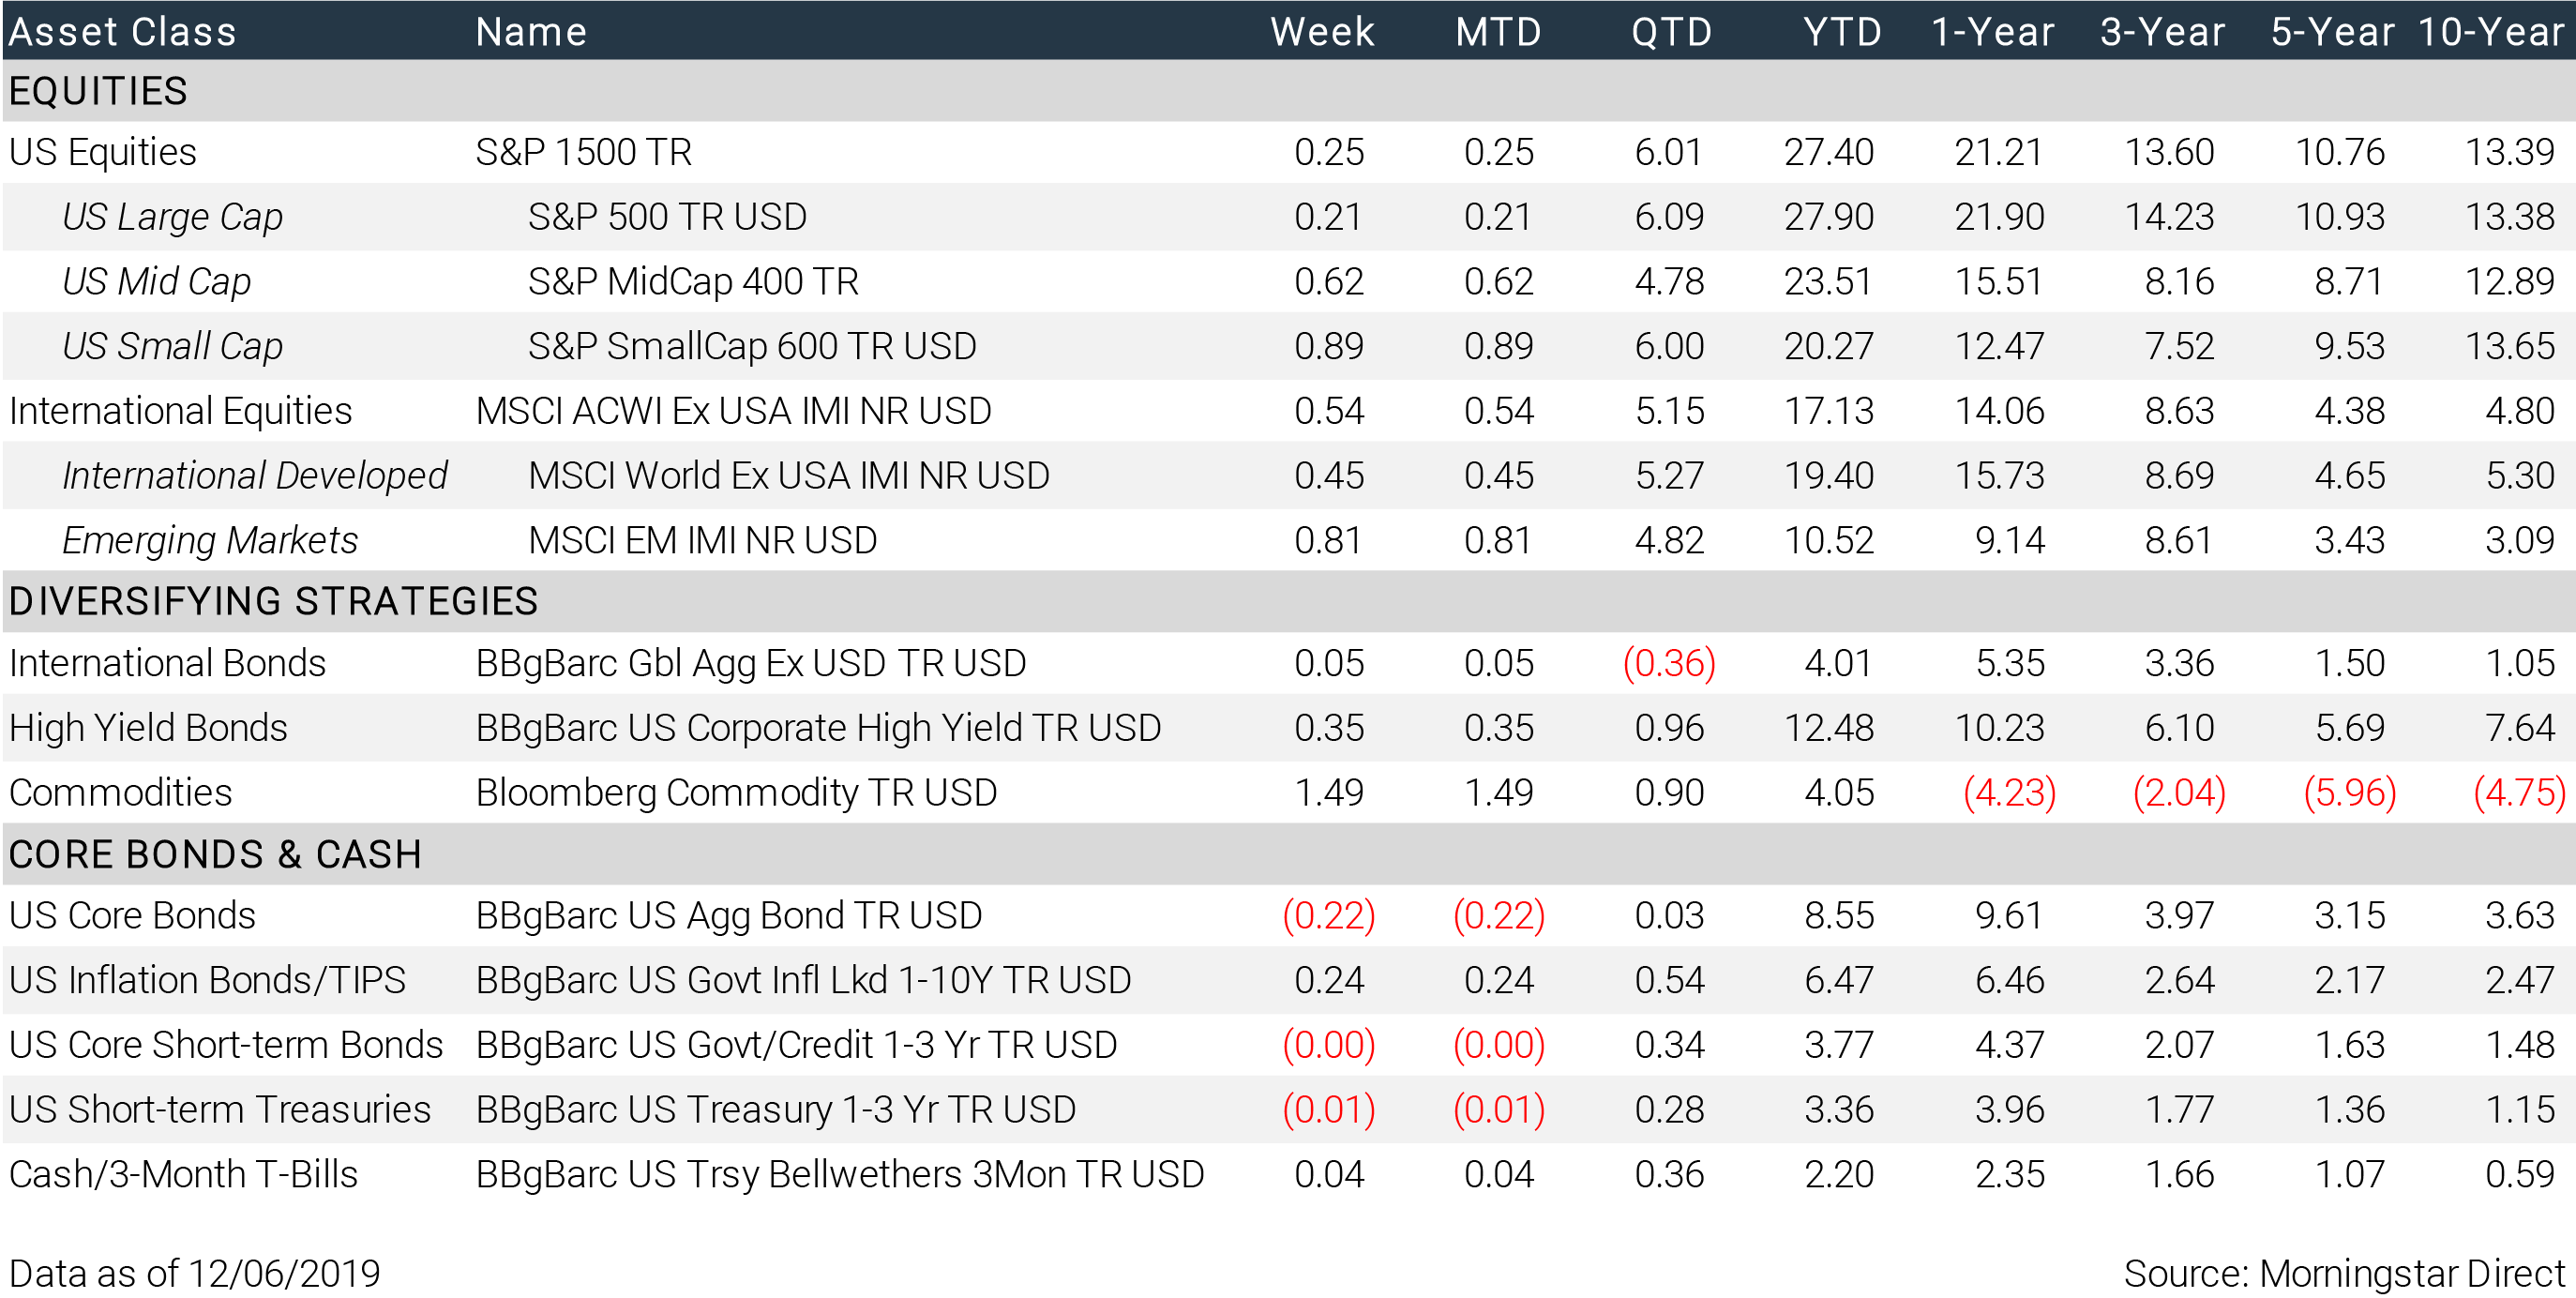
INDEX RETURNS
[1] https://www.cnbc.com/2019/12/03/trump-says-it-might-be-better-to-wait-until-after-2020-election-for-a-china-deal.html
[4] https://www.washingtonpost.com/business/2019/10/16/terrible-pandemic-is-killing-pigs-around-world-us-pork-producers-fear-they-could-be-next/
[5] https://www.reuters.com/article/us-usa-trade-china/trump-will-make-final-call-on-china-tariffs-likes-direction-of-talks-kudlow-idUSKBN1YA1S4
[6] https://www.reuters.com/article/us-france-us-de/france-ready-to-take-trumps-tariff-threat-to-wto-le-maire-idUSKBN1YC0BZ
[10] https://fred.stlouisfed.org/series/UNRATE
IMPORTANT DISCLOSURE INFORMATION
Please remember that past performance may not be indicative of future results. Different types of investments involve varying degrees of risk, and there can be no assurance that the future performance of any specific investment, investment strategy, or product (including the investments and/or investment strategies recommended or undertaken by MCF), or any non-investment related content, made reference to directly or indirectly in this newsletter will be profitable, equal any corresponding indicated historical performance level(s), be suitable for your portfolio or individual situation, or prove successful. Due to various factors, including changing market conditions and/or applicable laws, the content may no longer be reflective of current opinions or positions. Moreover, you should not assume that any discussion or information contained in this newsletter serves as the receipt of, or as a substitute for, personalized investment advice from MCF. To the extent that a reader has any questions regarding the applicability of any specific issue discussed above to his/her individual situation, he/she is encouraged to consult with the professional advisor of his/her choosing. MCF is neither a law firm nor a certified public accounting firm and no portion of the newsletter content should be construed as legal or accounting advice. A copy of the MCF’s current written disclosure statement discussing our advisory services and fees is available upon request. If you are an MCF client, please remember to contact MCF, in writing, if there are any changes in your personal/financial situation or investment objectives for the purpose of reviewing/evaluating/revising our previous recommendations and/or services. Please click here to review our full disclosure.
REFLECTED INDICES
S&P Composite 1500® Index combines three leading indices, the S&P 500®, the S&P MidCap 400®, and the S&P SmallCap 600® to cover approximately 90% of the US market capitalization. It is designed for investors seeking to replicate the performance of the US equity market or benchmark against a representative universe of tradable stocks. Investors cannot invest in an index.
MSCI ACWI ex USA Index captures large and mid-cap representation across 22 of 23 Developed Markets (DM) countries (excluding the US) and 23 Emerging Markets (EM) countries. With 1,859 constituents, the index covers approximately 85% of the global equity opportunity set outside the US. Investors cannot invest in an index.
Bloomberg Barclays Global Aggregate ex-USD Index is a measure of global investment grade debt from 24 local currency markets. This multi- currency benchmark includes treasury, government-related, corporate and securitized fixed-rate bonds from both developed and emerging markets issuers. Investors cannot invest in an index.
Bloomberg Barclays High Yield Corporate Bond Index measures the USD-denominated, high yield, fixed-rate corporate bond market. Securities are classified as high yield if the middle rating of Moody's, Fitch and S&P is Ba1/BB+/BB+ or below. Bonds from issuers with an emerging markets country of risk, based on Barclays EM country definition, are excluded. Investors cannot invest in an index.
S&P GSCI is a composite index of commodity sector returns which represents a broadly diversified, unleveraged, long-only position in commodity futures. The S&P GSCI is intended to provide exposure to broad-based commodities. Investors cannot invest in an index.
Bloomberg Barclays US Aggregate Bond Index is a broad-based flagship benchmark that measures the investment grade, US dollar-denominated, fixed- rate taxable bond market. The index includes Treasuries, government-related and corporate securities, MBS (agency fixed-rate and hybrid ARM pass- through), ABS and CMBS (agency and non-agency). Provided the necessary inclusion rules are met, US Aggregate eligible securities also contribute to the multi-currency Global Aggregate Index and the US universal Index, which includes high yield and emerging markets debt. The US Aggregate Index was created in 1986 with history backfilled to January 1, 1976. Investors cannot invest in an index.
Bloomberg Barclays 1-10 Year US Government Inflation-Linked Bond Index tracks the 1-10-year inflation protected sector of the United States Treasury market. Investors cannot invest in an index.
Bloomberg Barclays US Treasury 1-3 Year Index measures the performance of public obligations of the US Treasury with maturities of 1-3 years, including securities roll up to the US Aggregate, US Universal, and Global Aggregate Indices. Investors cannot invest in an index.
Bloomberg Barclays US Treasury Bellwethers 3 Month Index is an unmanaged index representing the on-the-run (most recently auctioned) US Treasury bill with 3 months’ maturity. Investors cannot invest in an index.