
MCF Weekly Capital Market Review - June 10th, 2019
Fed Chair J. Powell’s opening conference remarks on June 4 reassured the public that the Fed “will act as appropriate to sustain the expansion”[1]. The remark was interpreted by market participants as a dovish turn, supporting the market’s pivot to an increased chance of a rate cut rather than rate hike for 2019. The Fed was hawkish at the end of 2018, with the dot plot indicating expectations of 2 rate hikes for 2019. However, in Powell’s words, expectations only provide guidance if the economy moves in the “least unlikely” scenario. We have not been moving in the least unlikely scenario. In the past, the Fed expressed the desire to avoid inverting the yield curve, a common (though sometimes unreliable) pre-recession indicator. Parts of the yield curve are already inverted, with the 1 month yield higher than the 10-year yield[2], and a cut would attempt to push down these short-term yields.
ISM and PMI Manufacturing Indices both signaled a manufacturing sector that is slowing but still growing. Both indices last peaked in August 2018 and since have trended downward, well before the recent trade disputes. Construction spending echoes this sentiment, peaking at the same time, falling since, and currently flat for last month. Hiring and wage inflation for May were positive but lower than expected; with an unemployment rate at 3.6%, the pool of available workers is limited. The Q1 GDP estimate is at 3.1%, but recent indicators are not pointing to an economy capable of producing comparable numbers for Q2. However, the economy is still growing at a modestly positive rate, supported by May’s Beige book, and not pointing to negative growth (contraction)[3].
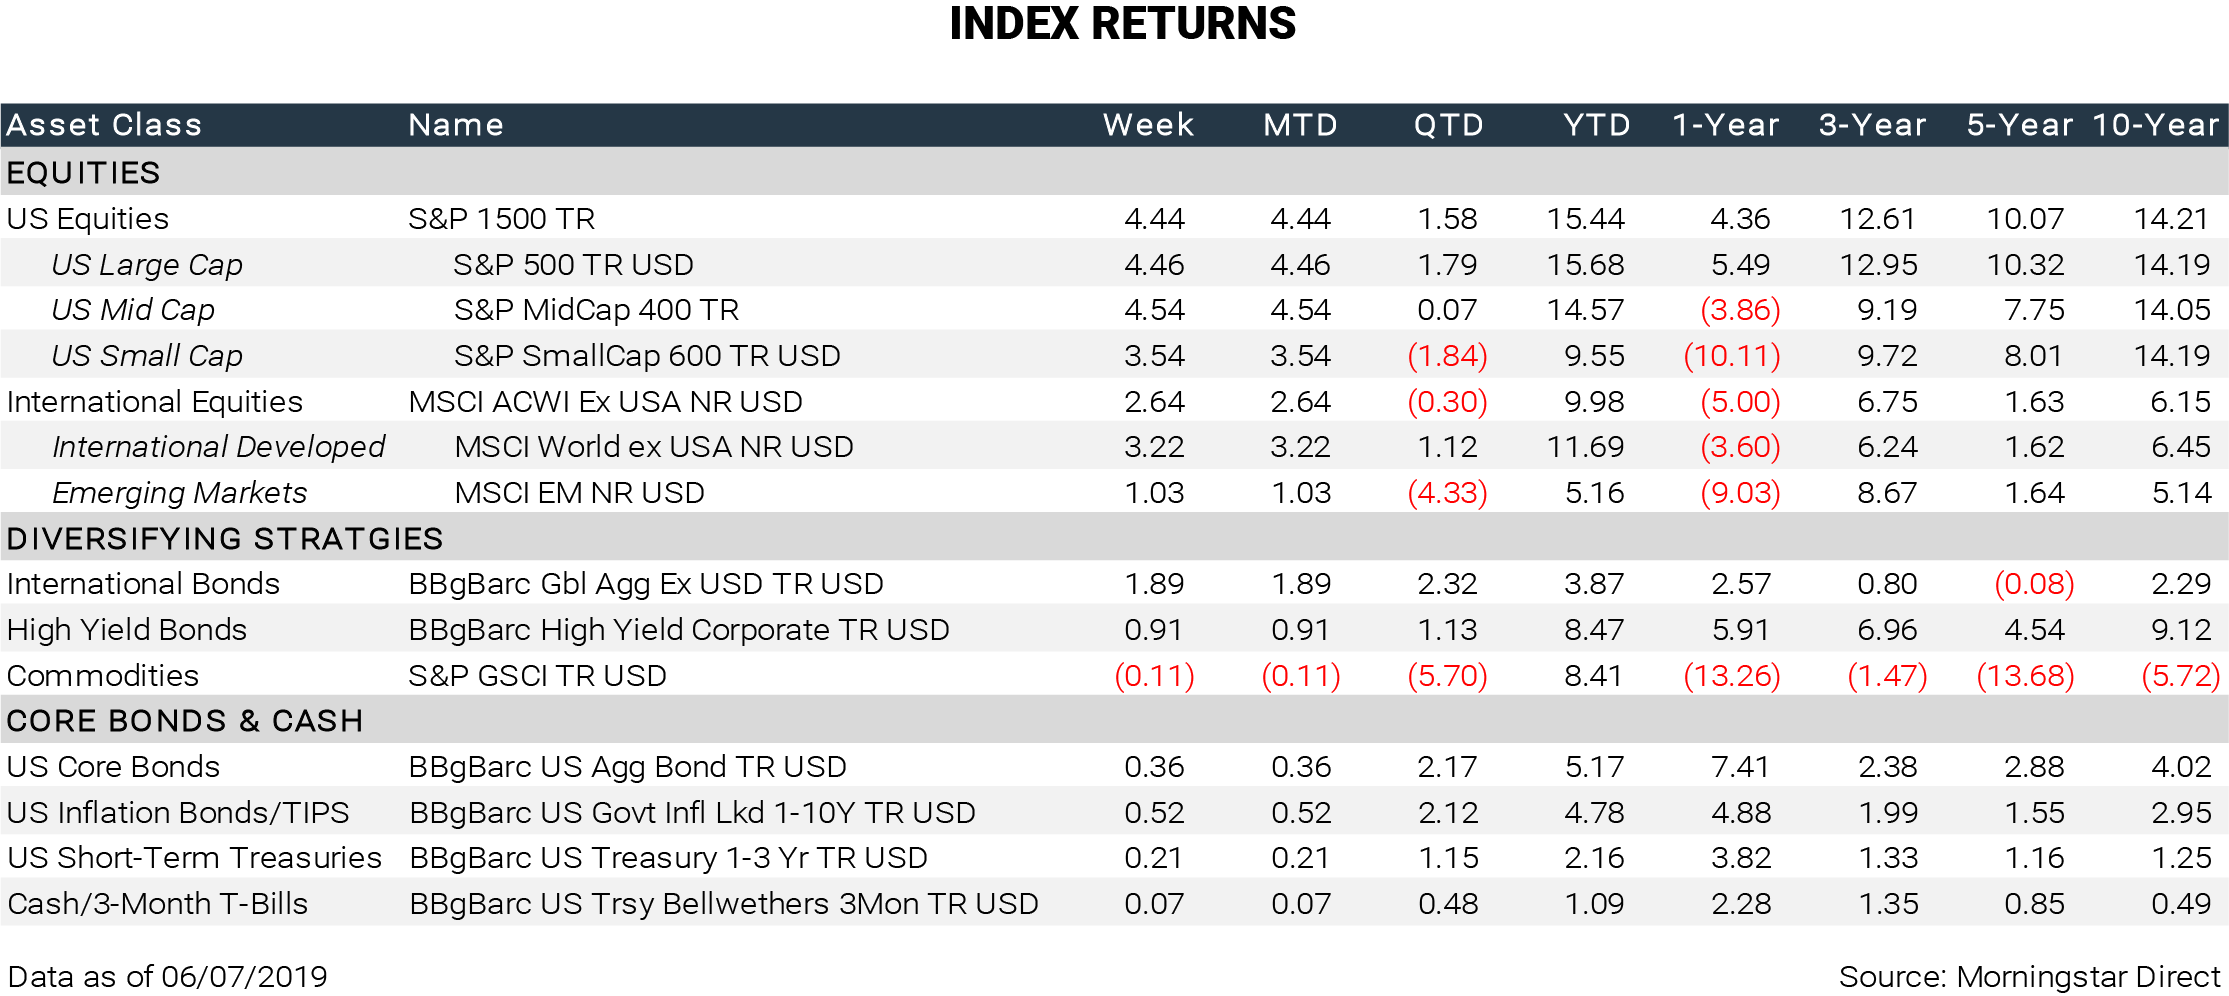
Despite the lack of better-than-expected indicators, the S&P 500 gained over 4% last week, primarily due to Powell’s comments and the market expectations of a coming rate cut. The US-Mexico trade dispute appears to be winding down, with Mexico agreeing to step up its immigration enforcement efforts and the US indefinitely suspending the initially proposed 5% tariffs[4]. As a result, NAFTA has been renegotiated with the new trade deal dubbed United States-Mexico-Canada Agreement (USMCA)[5], pending ratification. The US-China dispute still lingers but the apparent end to the US-Mexico dispute should remove some uncertainty and be a positive for markets.
Industrial production and business inventories indicators will be released this week on the latest business activity. This week’s inflation indicators include PPI and CPI that may influence coming Fed policy. Retail sales and consumer sentiment will be released Friday to close out the week.
[2] https://www.treasury.gov/resource-center/data-chart-center/interest-rates/pages/textview.aspx?data=yield
[4] https://www.cbsnews.com/news/trump-tariff-mexico-president-says-cancels-plan-after-deal-reached-on-immigration-today-2019-06-08/
[5] https://ustr.gov/trade-agreements/free-trade-agreements/united-states-mexico-canada-agreement
IMPORTANT DISCLOSURE INFORMATION
Please remember that past performance may not be indicative of future results. Different types of investments involve varying degrees of risk, and there can be no assurance that the future performance of any specific investment, investment strategy, or product (including the investments and/or investment strategies recommended or undertaken by MCF), or any non-investment related content, made reference to directly or indirectly in this newsletter will be profitable, equal any corresponding indicated historical performance level(s), be suitable for your portfolio or individual situation, or prove successful. Due to various factors, including changing market conditions and/or applicable laws, the content may no longer be reflective of current opinions or positions. Moreover, you should not assume that any discussion or information contained in this newsletter serves as the receipt of, or as a substitute for, personalized investment advice from MCF. To the extent that a reader has any questions regarding the applicability of any specific issue discussed above to his/her individual situation, he/she is encouraged to consult with the professional advisor of his/her choosing. MCF is neither a law firm nor a certified public accounting firm and no portion of the newsletter content should be construed as legal or accounting advice. A copy of the MCF’s current written disclosure statement discussing our advisory services and fees is available upon request. If you are a MCF client, please remember to contact MCF, in writing, if there are any changes in your personal/financial situation or investment objectives for the purpose of reviewing/evaluating/revising our previous recommendations and/or services. Please click here to review our full disclosure.
REFLECTED INDICES
S&P Composite 1500® Index combines three leading indices, the S&P 500®, the S&P MidCap 400®, and the S&P SmallCap 600® to cover approximately 90% of the US market capitalization. It is designed for investors seeking to replicate the performance of the US equity market or benchmark against a representative universe of tradable stocks. Investors cannot invest in an index.
MSCI ACWI ex USA Index captures large and mid cap representation across 22 of 23 Developed Markets (DM) countries (excluding the US) and 23 Emerging Markets (EM) countries. With 1,859 constituents, the index covers approximately 85% of the global equity opportunity set outside the US. Investors cannot invest in an index.
Bloomberg Barclays Global Aggregate ex-USD Index is a measure of global investment grade debt from 24 local currency markets. This multi- currency benchmark includes treasury, government-related, corporate and securitized fixed-rate bonds from both developed and emerging markets issuers. Investors cannot invest in an index.
Bloomberg Barclays High Yield Corporate Bond Index measures the USD-denominated, high yield, fixed-rate corporate bond market. Securities are classified as high yield if the middle rating of Moody's, Fitch and S&P is Ba1/BB+/BB+ or below. Bonds from issuers with an emerging markets country of risk, based on Barclays EM country definition, are excluded. Investors cannot invest in an index.
S&P GSCI is a composite index of commodity sector returns which represents a broadly diversified, unleveraged, long-only position in commodity futures. The S&P GSCI is intended to provide exposure to broad-based commodities. Investors cannot invest in an index.
Bloomberg Barclays US Aggregate Bond Index is a broad-based flagship benchmark that measures the investment grade, US dollar-denominated, fixed- rate taxable bond market. The index includes Treasuries, government-related and corporate securities, MBS (agency fixed-rate and hybrid ARM pass- through), ABS and CMBS (agency and non-agency). Provided the necessary inclusion rules are met, US Aggregate eligible securities also contribute to the multi-currency Global Aggregate Index and the US universal Index, which includes high yield and emerging markets debt. The US Aggregate Index was created in 1986 with history backfilled to January 1, 1976. Investors cannot invest in an index.
Bloomberg Barclays 1-10 Year US Government Inflation-Linked Bond Index tracks the 1-10-year inflation protected sector of the United States Treasury market. Investors cannot invest in an index.
Bloomberg Barclays US Treasury 1-3 Year Index measures the performance of public obligations of the US Treasury with maturities of 1-3 years, including securities roll up to the US Aggregate, US Universal, and Global Aggregate Indices. Investors cannot invest in an index.
Bloomberg Barclays US Treasury Bellwethers 3 Month Index is an unmanaged index representing the on-the-run (most recently auctioned) US Treasury bill with 3 months’ maturity. Investors cannot invest in an index.