
MCF Weekly Capital Market Review - July 29th, 2019
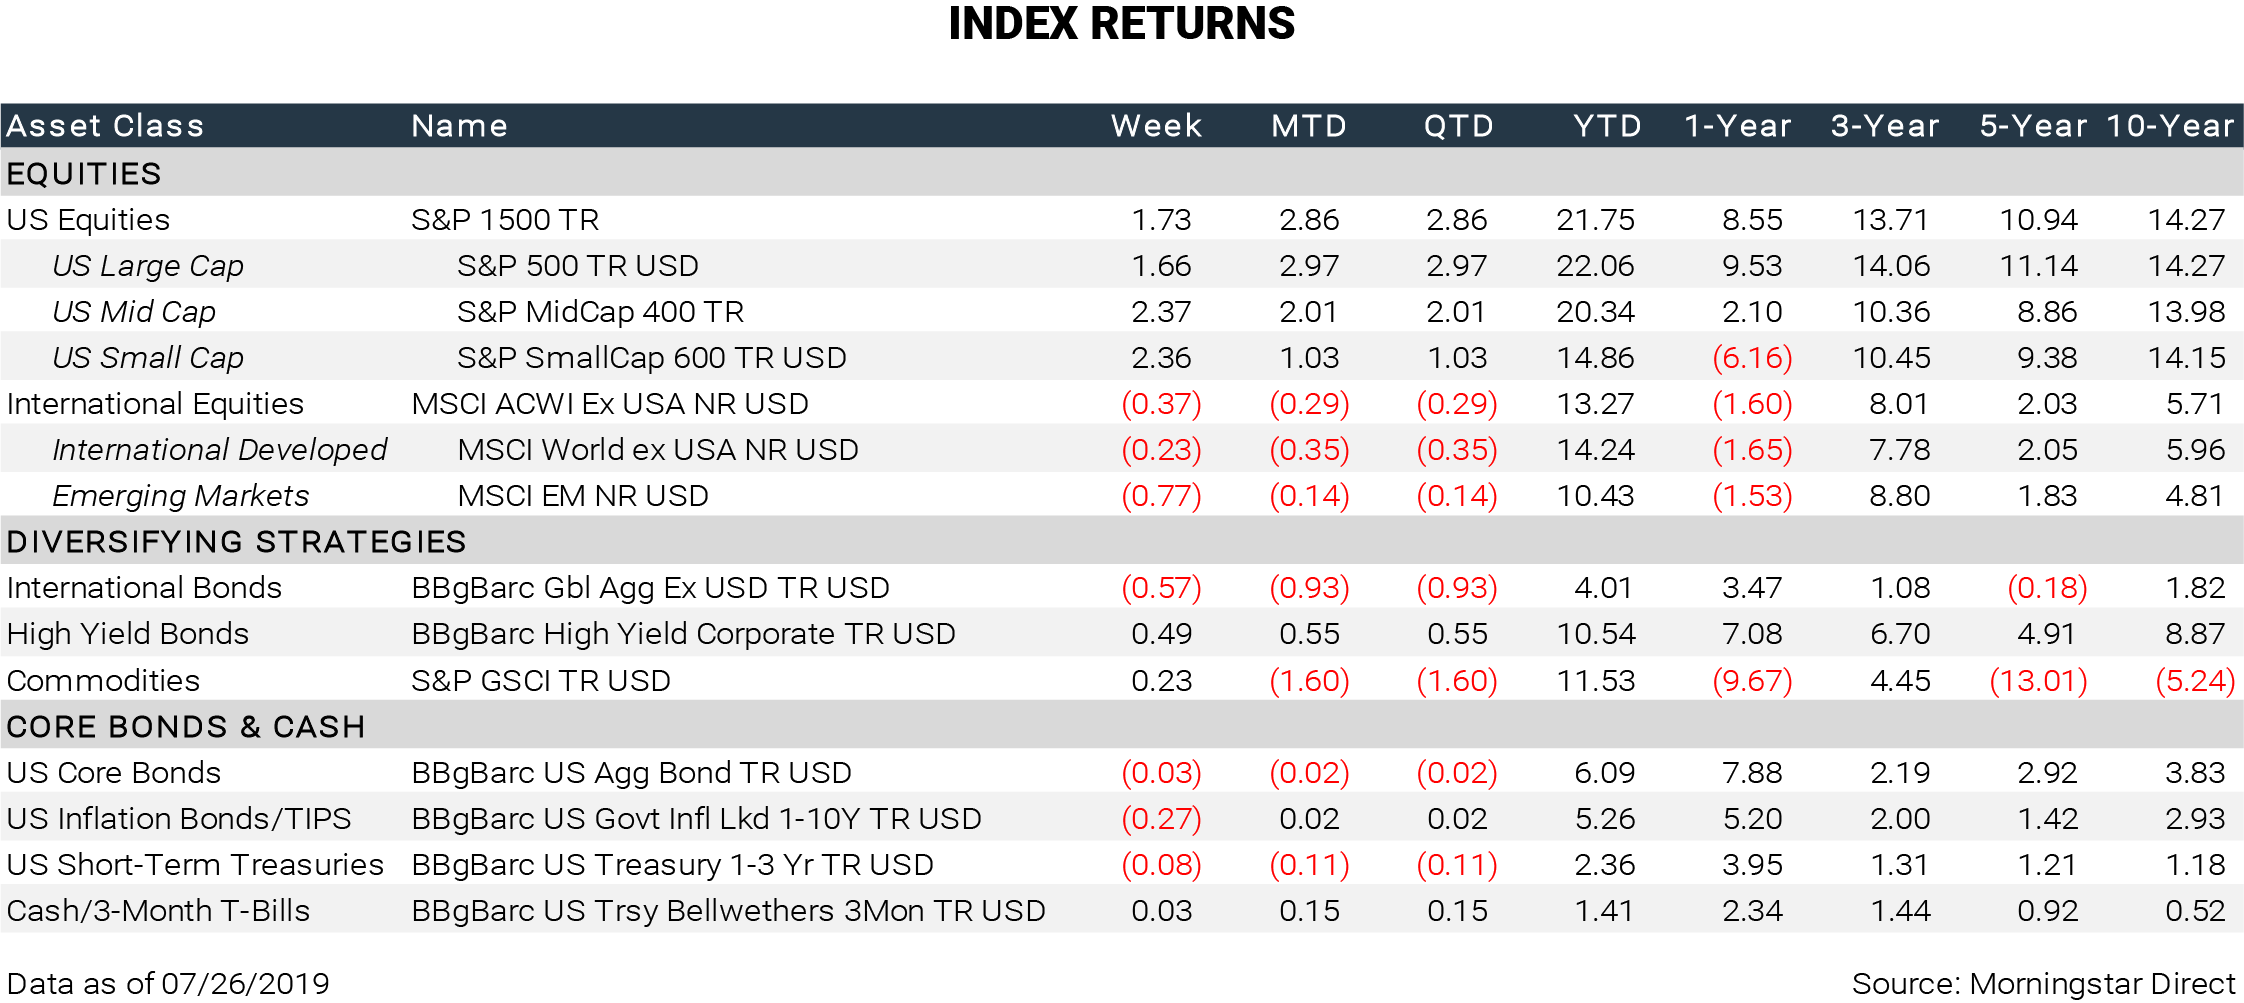
Mostly positive earnings reports buoyed markets the past two weeks. Most tech giants were positive, with beats from Microsoft, Alphabet, Facebook, and Twitter. Notable misses for the past two weeks included Amazon, Netflix, and Boeing. Heavy earnings releases continue for the next two weeks before tapering off. For the week, major US equities were positive although international equities were down.
A bill on the debt ceiling passed the Senate and now moves to the House and then President Trump, where it is expected to pass both. The bill strategically tables the debt ceiling issue, and chance of a government shutdown, through July 2021 - after the 2020 presidential election.[1] In Europe, UK’s new Prime Minister Boris Johnson has taken an adamant stance to meet the Brexit deadline of October 31 this year with “No ifs, no buts,”[2]; that is, with whatever deal (or lack thereof) is made. Until then, the financial and economic status between the UK and the EU remains in political purgatory.
Existing and new home sales are flattening out after a strong start to the year. Unemployment claims were on the low end, reflecting other data points that suggest strong labor markets. Durable goods exceeded upper-end consensus for a strong showing. Q2 real GDP came in at 2.1%, below the 3.1% figure from last quarter, but higher than the 1.9% consensus estimate. Market participants respond to surprises by comparing estimated pre-release figures with actual post-release figures, so a better-than-expected GDP also provided a positive backdrop for financial markets. Furthermore, the GDP report showed strength with both real consumer spending and the core price index surpassing upper-end consensus.[3]
This week will see the long-awaited FOMC meeting and decision on interest rate policy. As of Monday morning, market odds are betting on a 76.5% chance of 25 basis point cut and a 23.5% chance of a 50 basis point cut.[4] It is an interesting reminder that in December 2018, the Fed dot plot was forecasting two rate hikes for 2019. There are also a plethora of economic indicators coming out, including consumer confidence, personal income, manufacturing indices, and employment situation, to name a few.
[1] https://www.cnbc.com/2019/07/25/house-passes-debt-ceiling-and-budget-bill-sending-it-to-the-senate.html
[4] CME FedWatch Tool
IMPORTANT DISCLOSURE INFORMATION
Please remember that past performance may not be indicative of future results. Different types of investments involve varying degrees of risk, and there can be no assurance that the future performance of any specific investment, investment strategy, or product (including the investments and/or investment strategies recommended or undertaken by MCF), or any non-investment related content, made reference to directly or indirectly in this newsletter will be profitable, equal any corresponding indicated historical performance level(s), be suitable for your portfolio or individual situation, or prove successful. Due to various factors, including changing market conditions and/or applicable laws, the content may no longer be reflective of current opinions or positions. Moreover, you should not assume that any discussion or information contained in this newsletter serves as the receipt of, or as a substitute for, personalized investment advice from MCF. To the extent that a reader has any questions regarding the applicability of any specific issue discussed above to his/her individual situation, he/she is encouraged to consult with the professional advisor of his/her choosing. MCF is neither a law firm nor a certified public accounting firm and no portion of the newsletter content should be construed as legal or accounting advice. A copy of the MCF’s current written disclosure statement discussing our advisory services and fees is available upon request. If you are an MCF client, please remember to contact MCF, in writing, if there are any changes in your personal/financial situation or investment objectives for the purpose of reviewing/evaluating/revising our previous recommendations and/or services. Please click here to review our full disclosure.
REFLECTED INDICES
S&P Composite 1500® Index combines three leading indices, the S&P 500®, the S&P MidCap 400®, and the S&P SmallCap 600® to cover approximately 90% of the US market capitalization. It is designed for investors seeking to replicate the performance of the US equity market or benchmark against a representative universe of tradable stocks. Investors cannot invest in an index.
MSCI ACWI ex USA Index captures large and mid cap representation across 22 of 23 Developed Markets (DM) countries (excluding the US) and 23 Emerging Markets (EM) countries. With 1,859 constituents, the index covers approximately 85% of the global equity opportunity set outside the US. Investors cannot invest in an index.
Bloomberg Barclays Global Aggregate ex-USD Index is a measure of global investment grade debt from 24 local currency markets. This multi- currency benchmark includes treasury, government-related, corporate and securitized fixed-rate bonds from both developed and emerging markets issuers. Investors cannot invest in an index.
Bloomberg Barclays High Yield Corporate Bond Index measures the USD-denominated, high yield, fixed-rate corporate bond market. Securities are classified as high yield if the middle rating of Moody's, Fitch and S&P is Ba1/BB+/BB+ or below. Bonds from issuers with an emerging markets country of risk, based on Barclays EM country definition, are excluded. Investors cannot invest in an index.
S&P GSCI is a composite index of commodity sector returns which represents a broadly diversified, unleveraged, long-only position in commodity futures. The S&P GSCI is intended to provide exposure to broad-based commodities. Investors cannot invest in an index.
Bloomberg Barclays US Aggregate Bond Index is a broad-based flagship benchmark that measures the investment grade, US dollar-denominated, fixed- rate taxable bond market. The index includes Treasuries, government-related and corporate securities, MBS (agency fixed-rate and hybrid ARM pass- through), ABS and CMBS (agency and non-agency). Provided the necessary inclusion rules are met, US Aggregate eligible securities also contribute to the multi-currency Global Aggregate Index and the US universal Index, which includes high yield and emerging markets debt. The US Aggregate Index was created in 1986 with history backfilled to January 1, 1976. Investors cannot invest in an index.
Bloomberg Barclays 1-10 Year US Government Inflation-Linked Bond Index tracks the 1-10-year inflation protected sector of the United States Treasury market. Investors cannot invest in an index.
Bloomberg Barclays US Treasury 1-3 Year Index measures the performance of public obligations of the US Treasury with maturities of 1-3 years, including securities roll up to the US Aggregate, US Universal, and Global Aggregate Indices. Investors cannot invest in an index.
Bloomberg Barclays US Treasury Bellwethers 3 Month Index is an unmanaged index representing the on-the-run (most recently auctioned) US Treasury bill with 3 months’ maturity. Investors cannot invest in an index.